step 1
The Correlation Trader shows the correlation between symbols over a configurabletimeframe, e.g. recent H1 bars.Correlation is measured on a scale from -100 to +100:
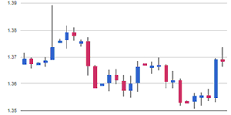
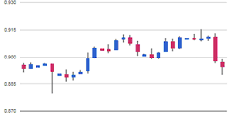
Correlation can have a major effect on your trading risk. For example the following charts show H1 EURUSD and USDCHF over the same time period:


These symbols had very strong negative correlation (about -95). If you were long EURUSD and short USDCHF over this period, or vice versa, then you would have seen very similar profits on both positions. In effect, you did not have two positions: you only really had one position. (If you were long both symbols, or short both symbols, then you probably had a profit on one and a matching loss on the other.)
It is generally advisable to minimise the correlation between your open positions. Otherwise, you are either trading the same price action twice over, or you have two positions which cancel each other out.
The Correlation Trader helps you to identify symbols with strong or weak correlation, and to trade emerging differences in the correlation.
step 2
2.1 Price charts
The Correlation Trader shows recent price charts for two symbols side by side (and can be used simply as a way of displaying two linked price charts):

2.2 Correlation
The bar in the middle lets you change the timeframe for the charts. It also shows the following:

2.2.1 Correlation values
The gauge shows the correlation on scale of 0 to ± 100. It makes little difference whether values are positive or negative (e.g. +90 or -90), and the meaning depends on whether you are long or short each symbol.
For example:
2.2.2 Correlation colors
The color of the gauge depends on the strength of the correlation:

2.3 Changing the symbol selection
You can change a symbols by clicking on its name. The label is replaced with an editable box where you can type in a new symbol name, with auto-complete.
2.4 Opening and closing positions
[Please note: the order tab is not available on the tradable platform]
You can use the New Order to carry out simple trading actions such as closing an open position or opening a new one.

The top of the trading form shows any open position in the selected symbol, with a button for closing the position. Below that is a simple form for placing a new buy or sell market order.
Open a HedgeHood trading account today and join over a million others globally trading 2,000+ markets on an easy-to-use platform. Go long or short with competitive spreads on indices, shares, forex, gold, commodities, cryptocurrencies, bonds and more. Plus, get extended hours on major US shares, AI-powered tools and 24/5 client support. Learn more about trading CFDs with HedgeHood.

Licensed & Trusted

Research & Education

Technical Analysis Tools

Transparent Pricing

One-stop Destination

24/5 Live Support

Forex Webinars

Trade On The Go

Same Day Account Opening

Our dedicated team of customer support agents are on hand 24/5 to provide you with multilingual support. Contact Us

Visit our comprehensive FAQ where you can find information about the services we offer and answers to your trading questions. Help Centre