step 1
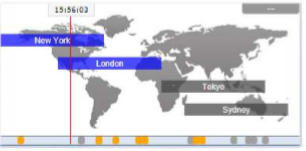
The Session Map shows your current local time in relation to “sessions” during the trading day, i.e. the core trading hours when institutional dealers are most active in Sydney, Tokyo, London and New York.
(For example, Tokyo trading is defined as 11pm GMT to 8am GMT, or 8am to 5pm Tokyo time.)
The Session Map also shows markers for future news events; information about your floating P/L and equity; and price activity during each session.

Please note: the current time is taken from your computer clock, and its accuracy depends on your computer clock being accurate.
1.1 News markers
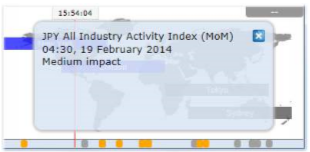
The bar at the bottom of the map shows markers for future news events, e.g. non-farm payroll. (Items to the right of the current time are not in the past: they are a long way into the future.)
Each marker is color-coded to indicate its importance: red for high-impact events; orange for medium; and gray for low.
You can hover the mouse over a marker to display a tooltip showing what the event is, and you can click on a marker to see that text in full. For example:

1.2 Floating P/L, account information, and color-coding
The box at the top of the map shows the current floating P/L on your account (if any). In the example above, the floating P/L is a loss of TODO.
The map is color-coded depending on the floating P/L: green for profit; red for loss; gray if no open position.
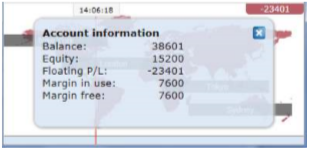
You can get a summary of your account by clicking on the P/L box.
For example:

1.3 Session bars
If you hover the mouse over a session bar such as “Sydney”, you will see a tooltip showing the current local time in Sydney and how long it is until core trading opens or closes in that region.
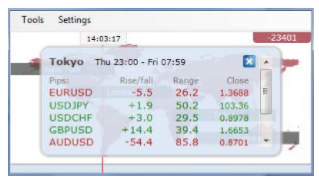
You can also click on a session bar to show a summary of price action for major symbols during that session.
The following example shows the most recent trading in Tokyo. EURUSD fell 5.5 pips during the session, with a trading range of 26.2 pips, closing at 1.3688.

Please note: the prices used in the Session Map are an average of multiple brokers and may differ very slightly from the prices displayed by your broker.
Open a HedgeHood trading account today and join over a million others globally trading 2,000+ markets on an easy-to-use platform. Go long or short with competitive spreads on indices, shares, forex, gold, commodities, cryptocurrencies, bonds and more. Plus, get extended hours on major US shares, AI-powered tools and 24/5 client support. Learn more about trading CFDs with HedgeHood.

Licensed & Trusted

Research & Education

Technical Analysis Tools

Transparent Pricing

One-stop Destination

24/5 Live Support

Forex Webinars

Trade On The Go

Same Day Account Opening

Our dedicated team of customer support agents are on hand 24/5 to provide you with multilingual support. Contact Us

Visit our comprehensive FAQ where you can find information about the services we offer and answers to your trading questions. Help Centre